Reports Hub
The Reports hub is where the transactions you log turn into a clear picture — income, expenses, savings, and trends over time, with no bank connection needed.
- 1
Open the Reports hub
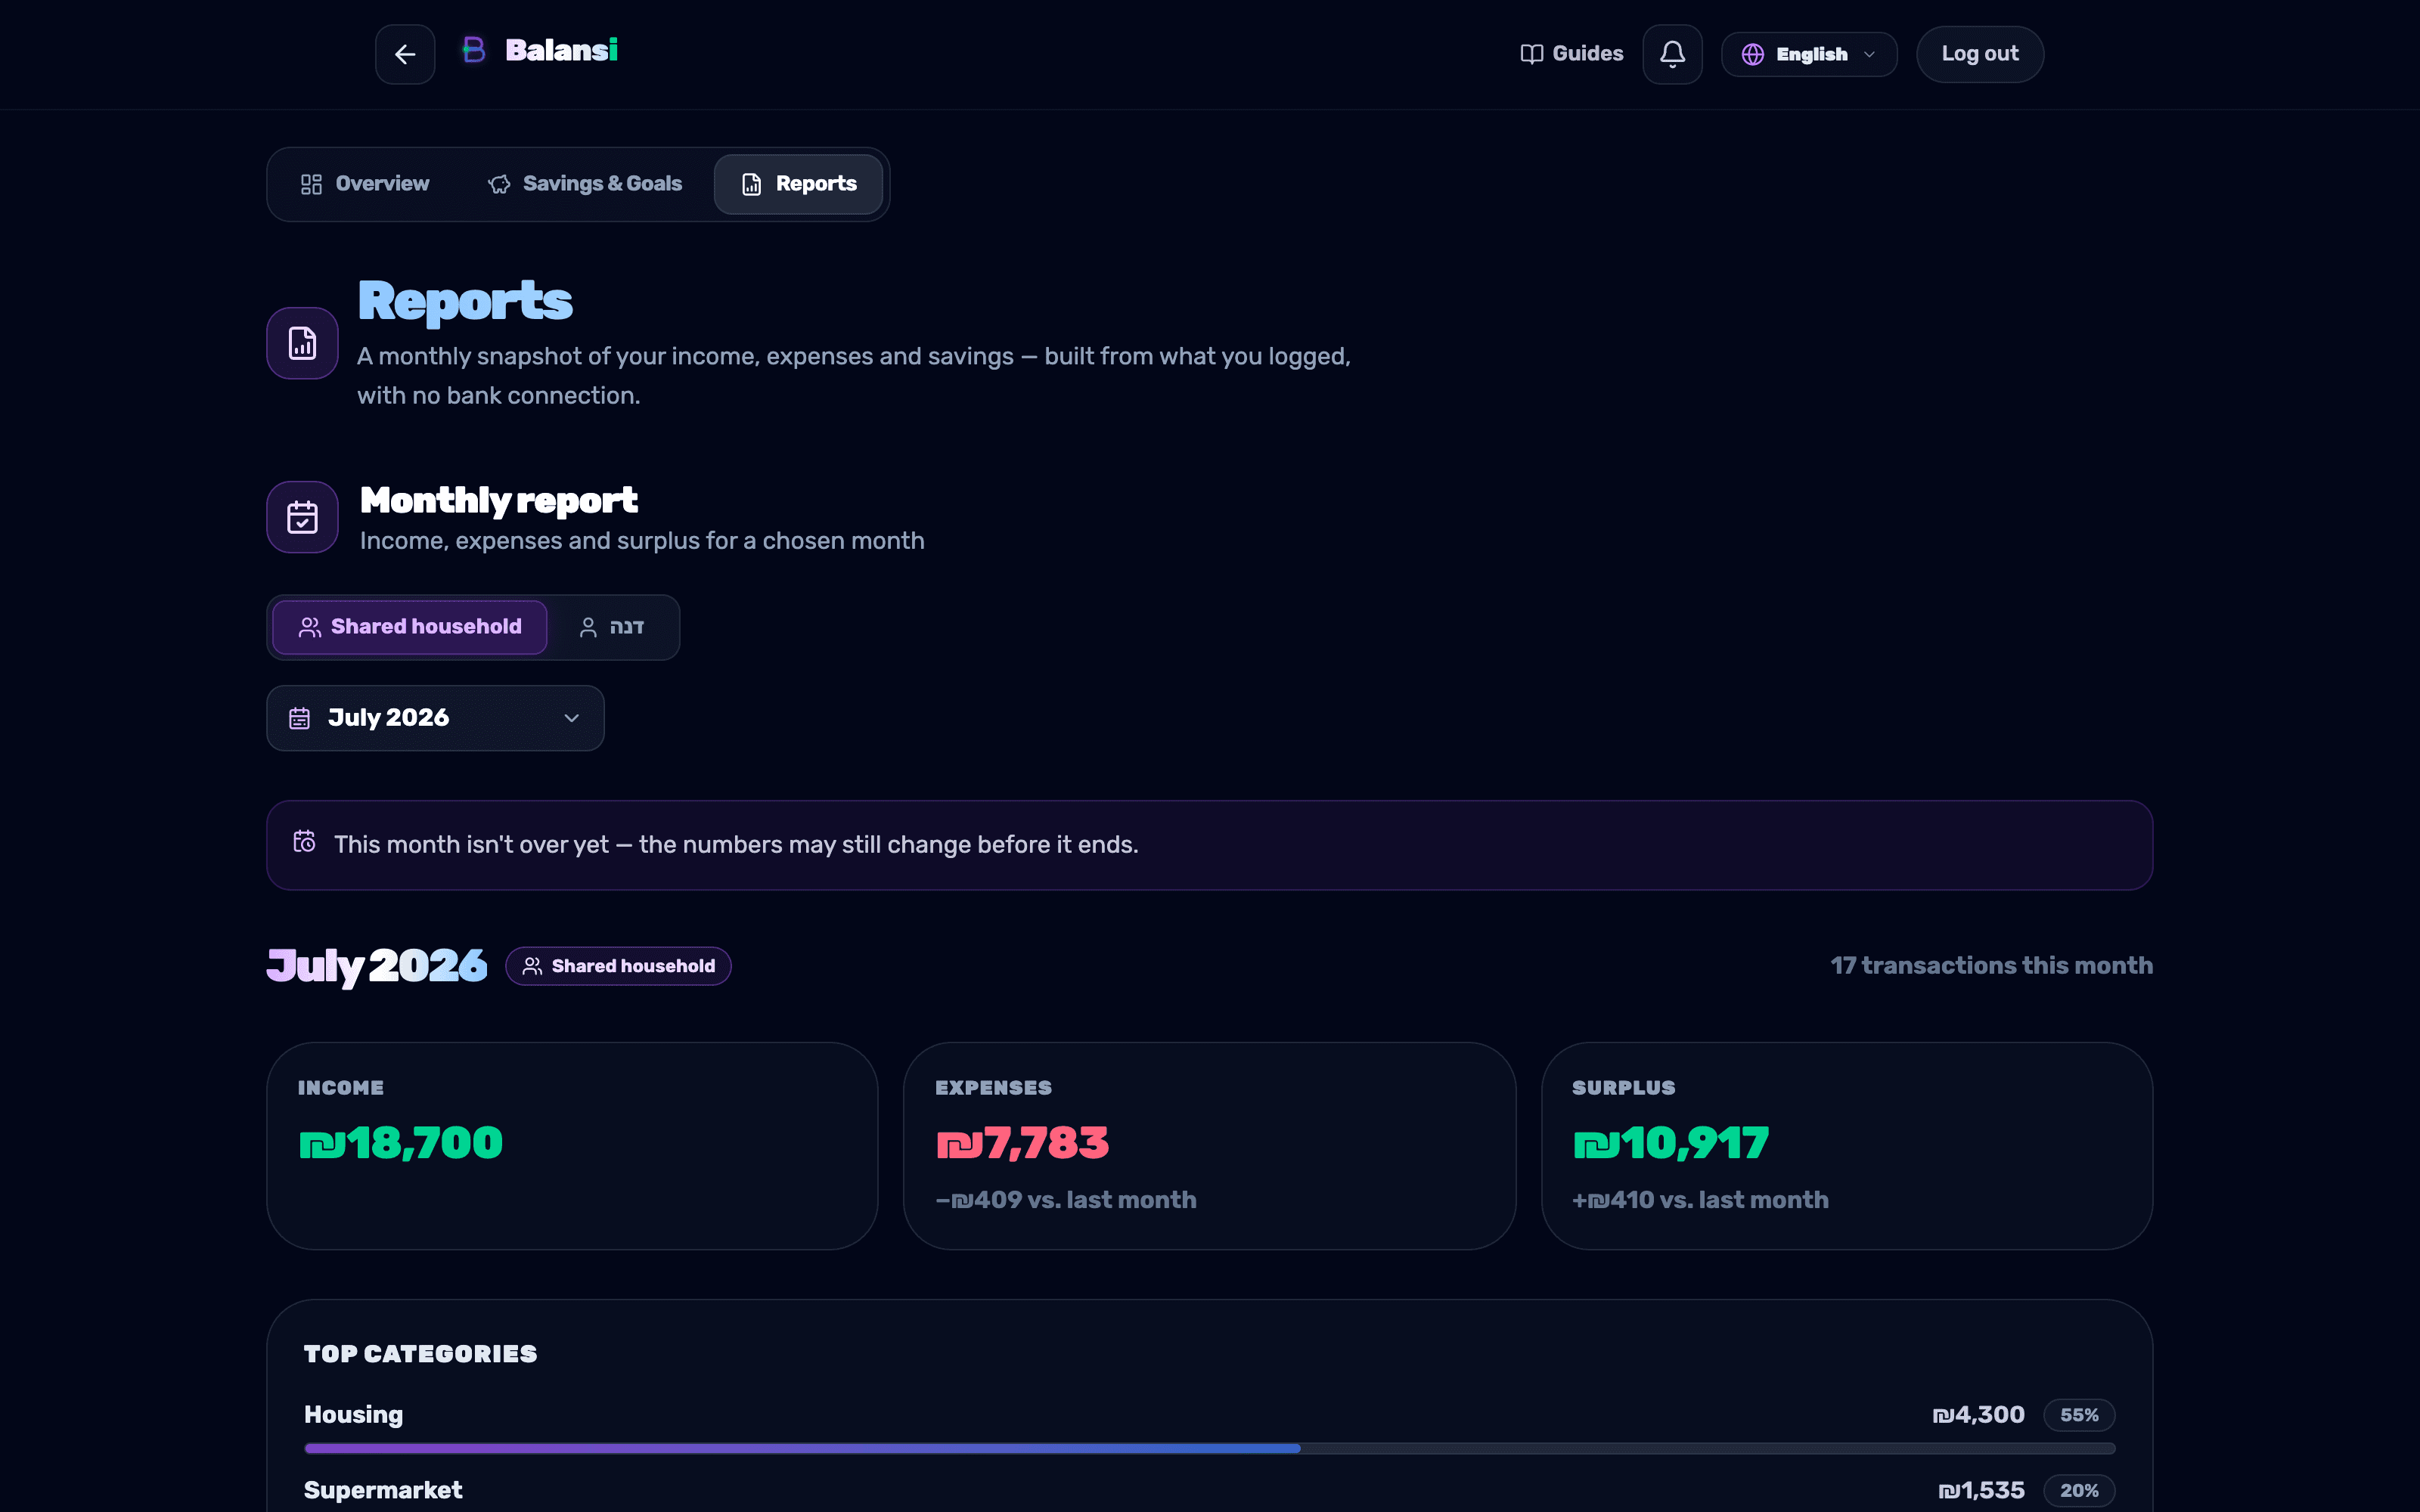
In the tab bar at the top of the dashboard (Overview / Savings & Goals / Reports), select "Reports." It opens by default to the "Monthly report" — income, expenses, and surplus for the selected month — with a "More reports" row of other cards below it.
- 2
Pick a month to view
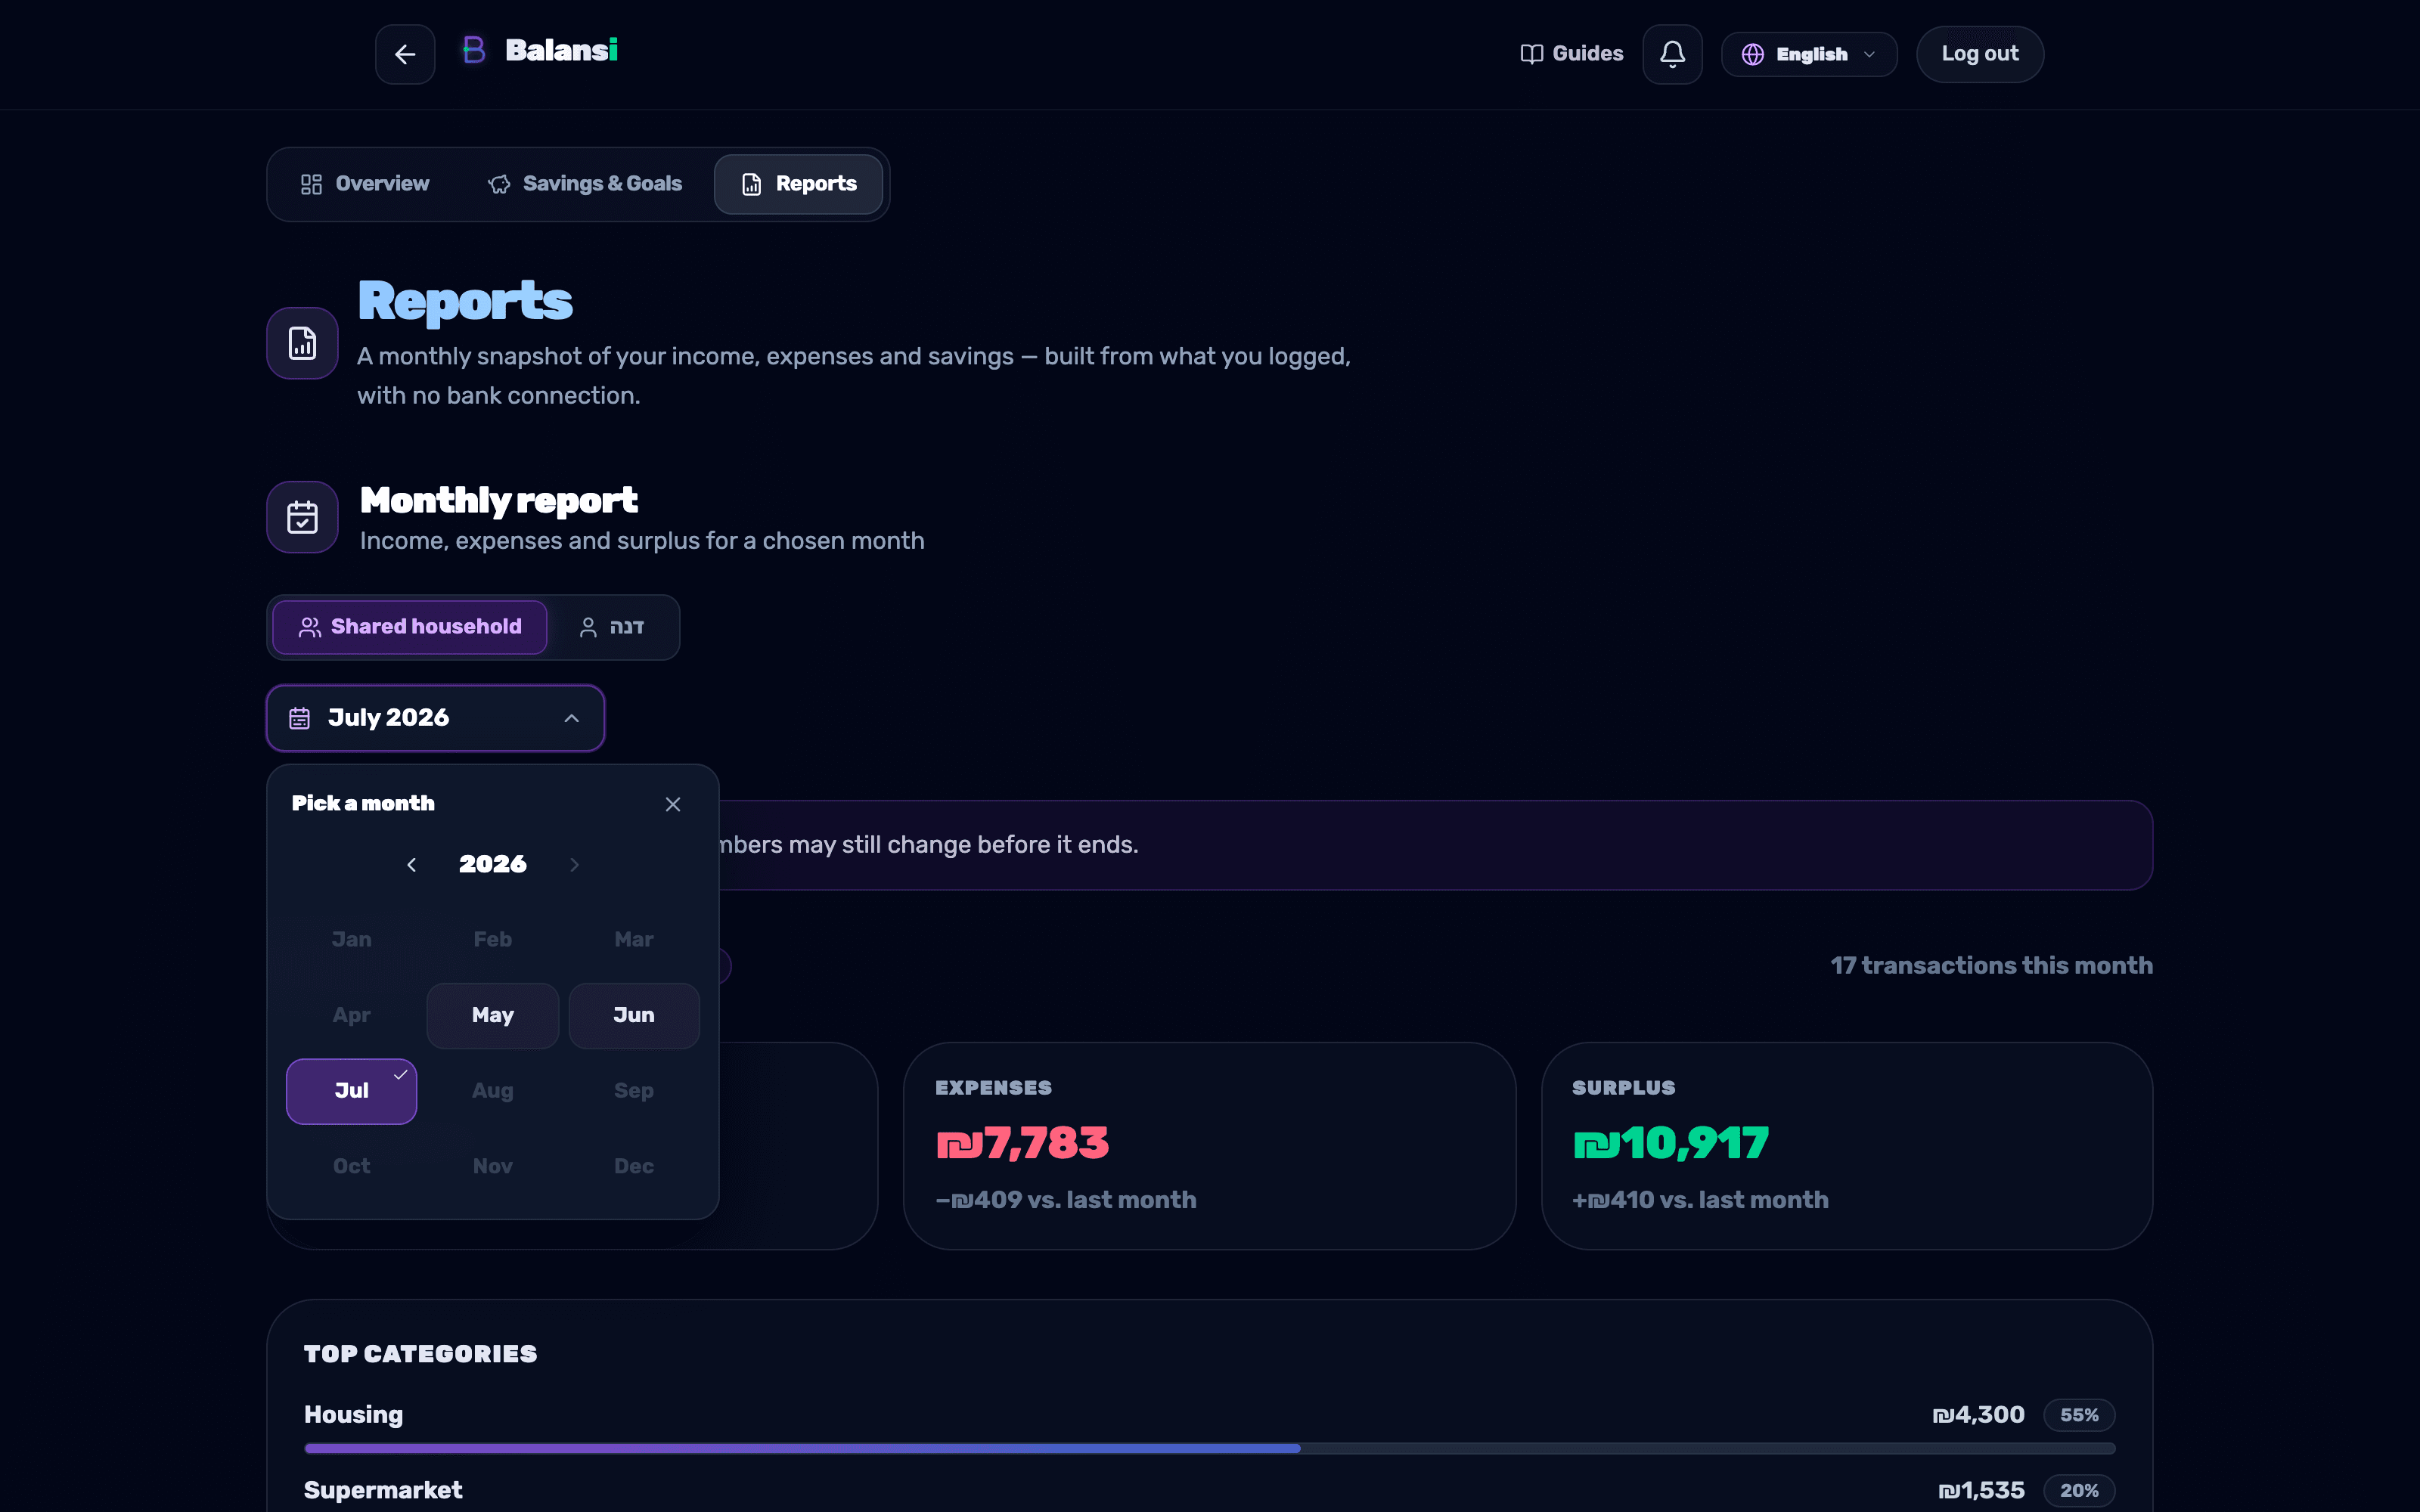
Tap the month button at the top of the report — a "Pick month" panel opens with year tabs ("Previous year" / "Next year") and a grid of all 12 months. Months without data are dimmed, and the current month has a subtle ring around it.
- 3
Read the key figures
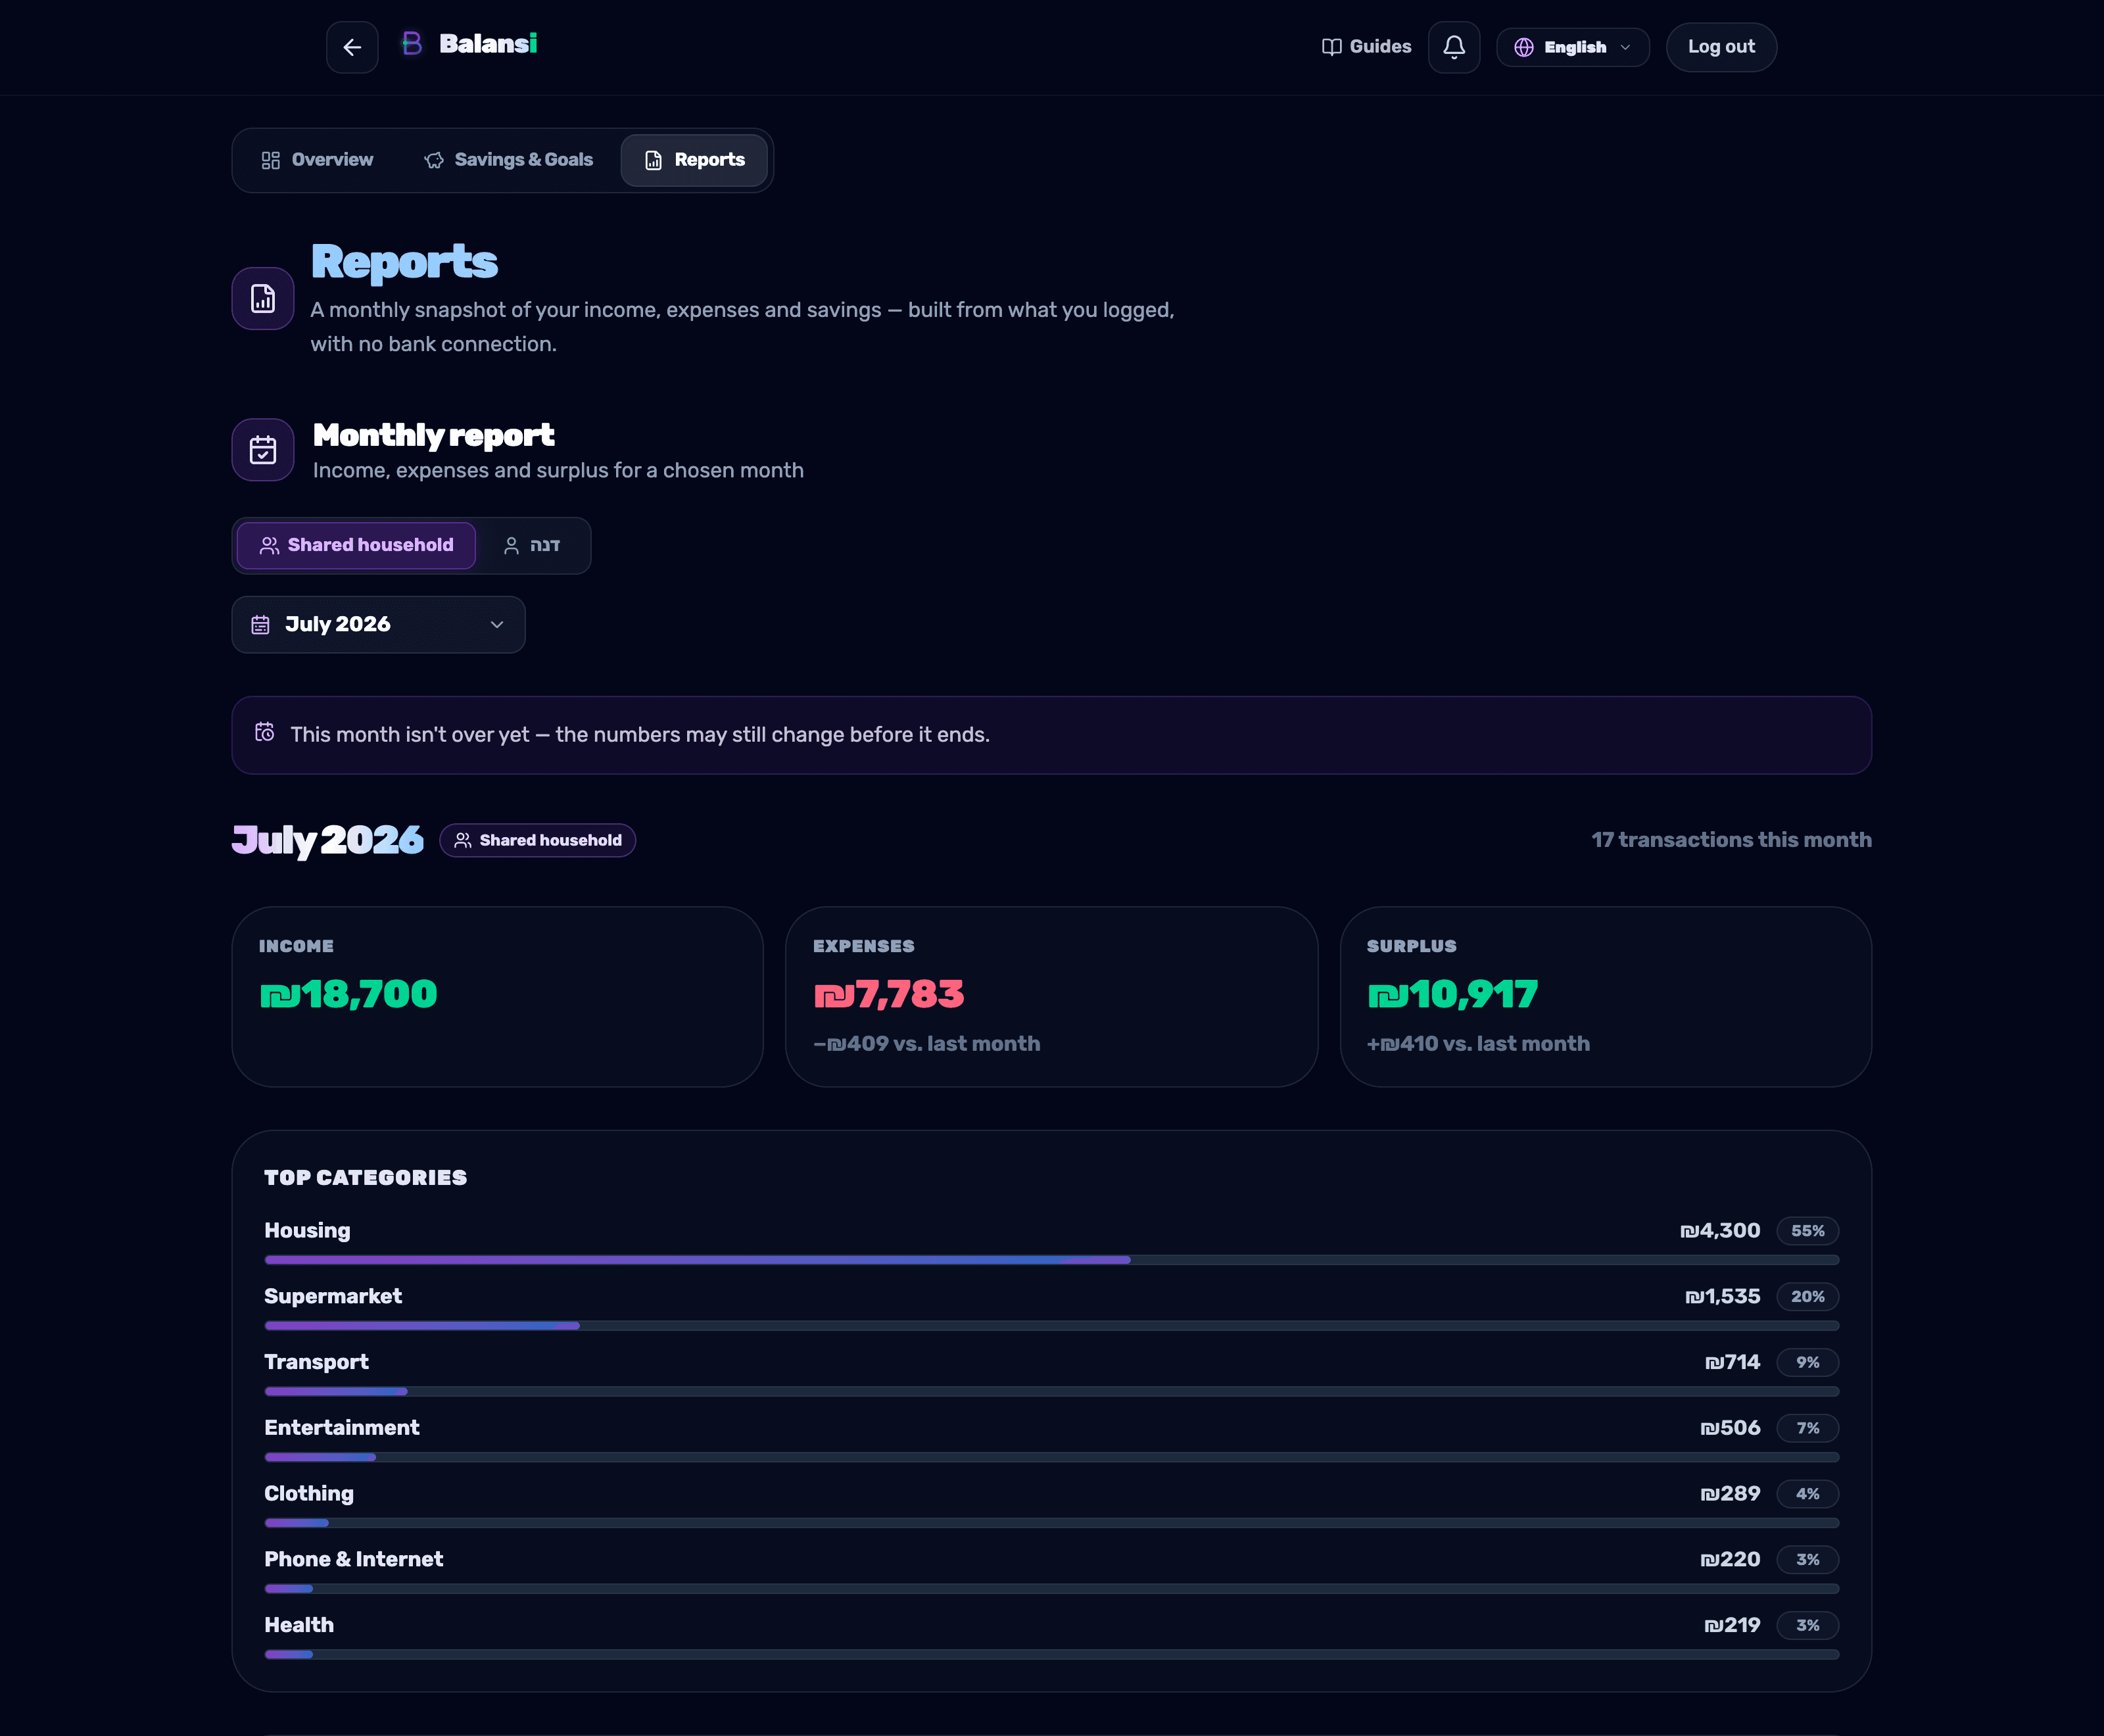
The monthly report shows "Income," "Expenses," and "Surplus" (or "Deficit"), alongside a "vs. last month" comparison, "Top categories," and "Notable changes." If the month is still in progress, a note warns the numbers may still shift.
- 4
Switch between the nine reports
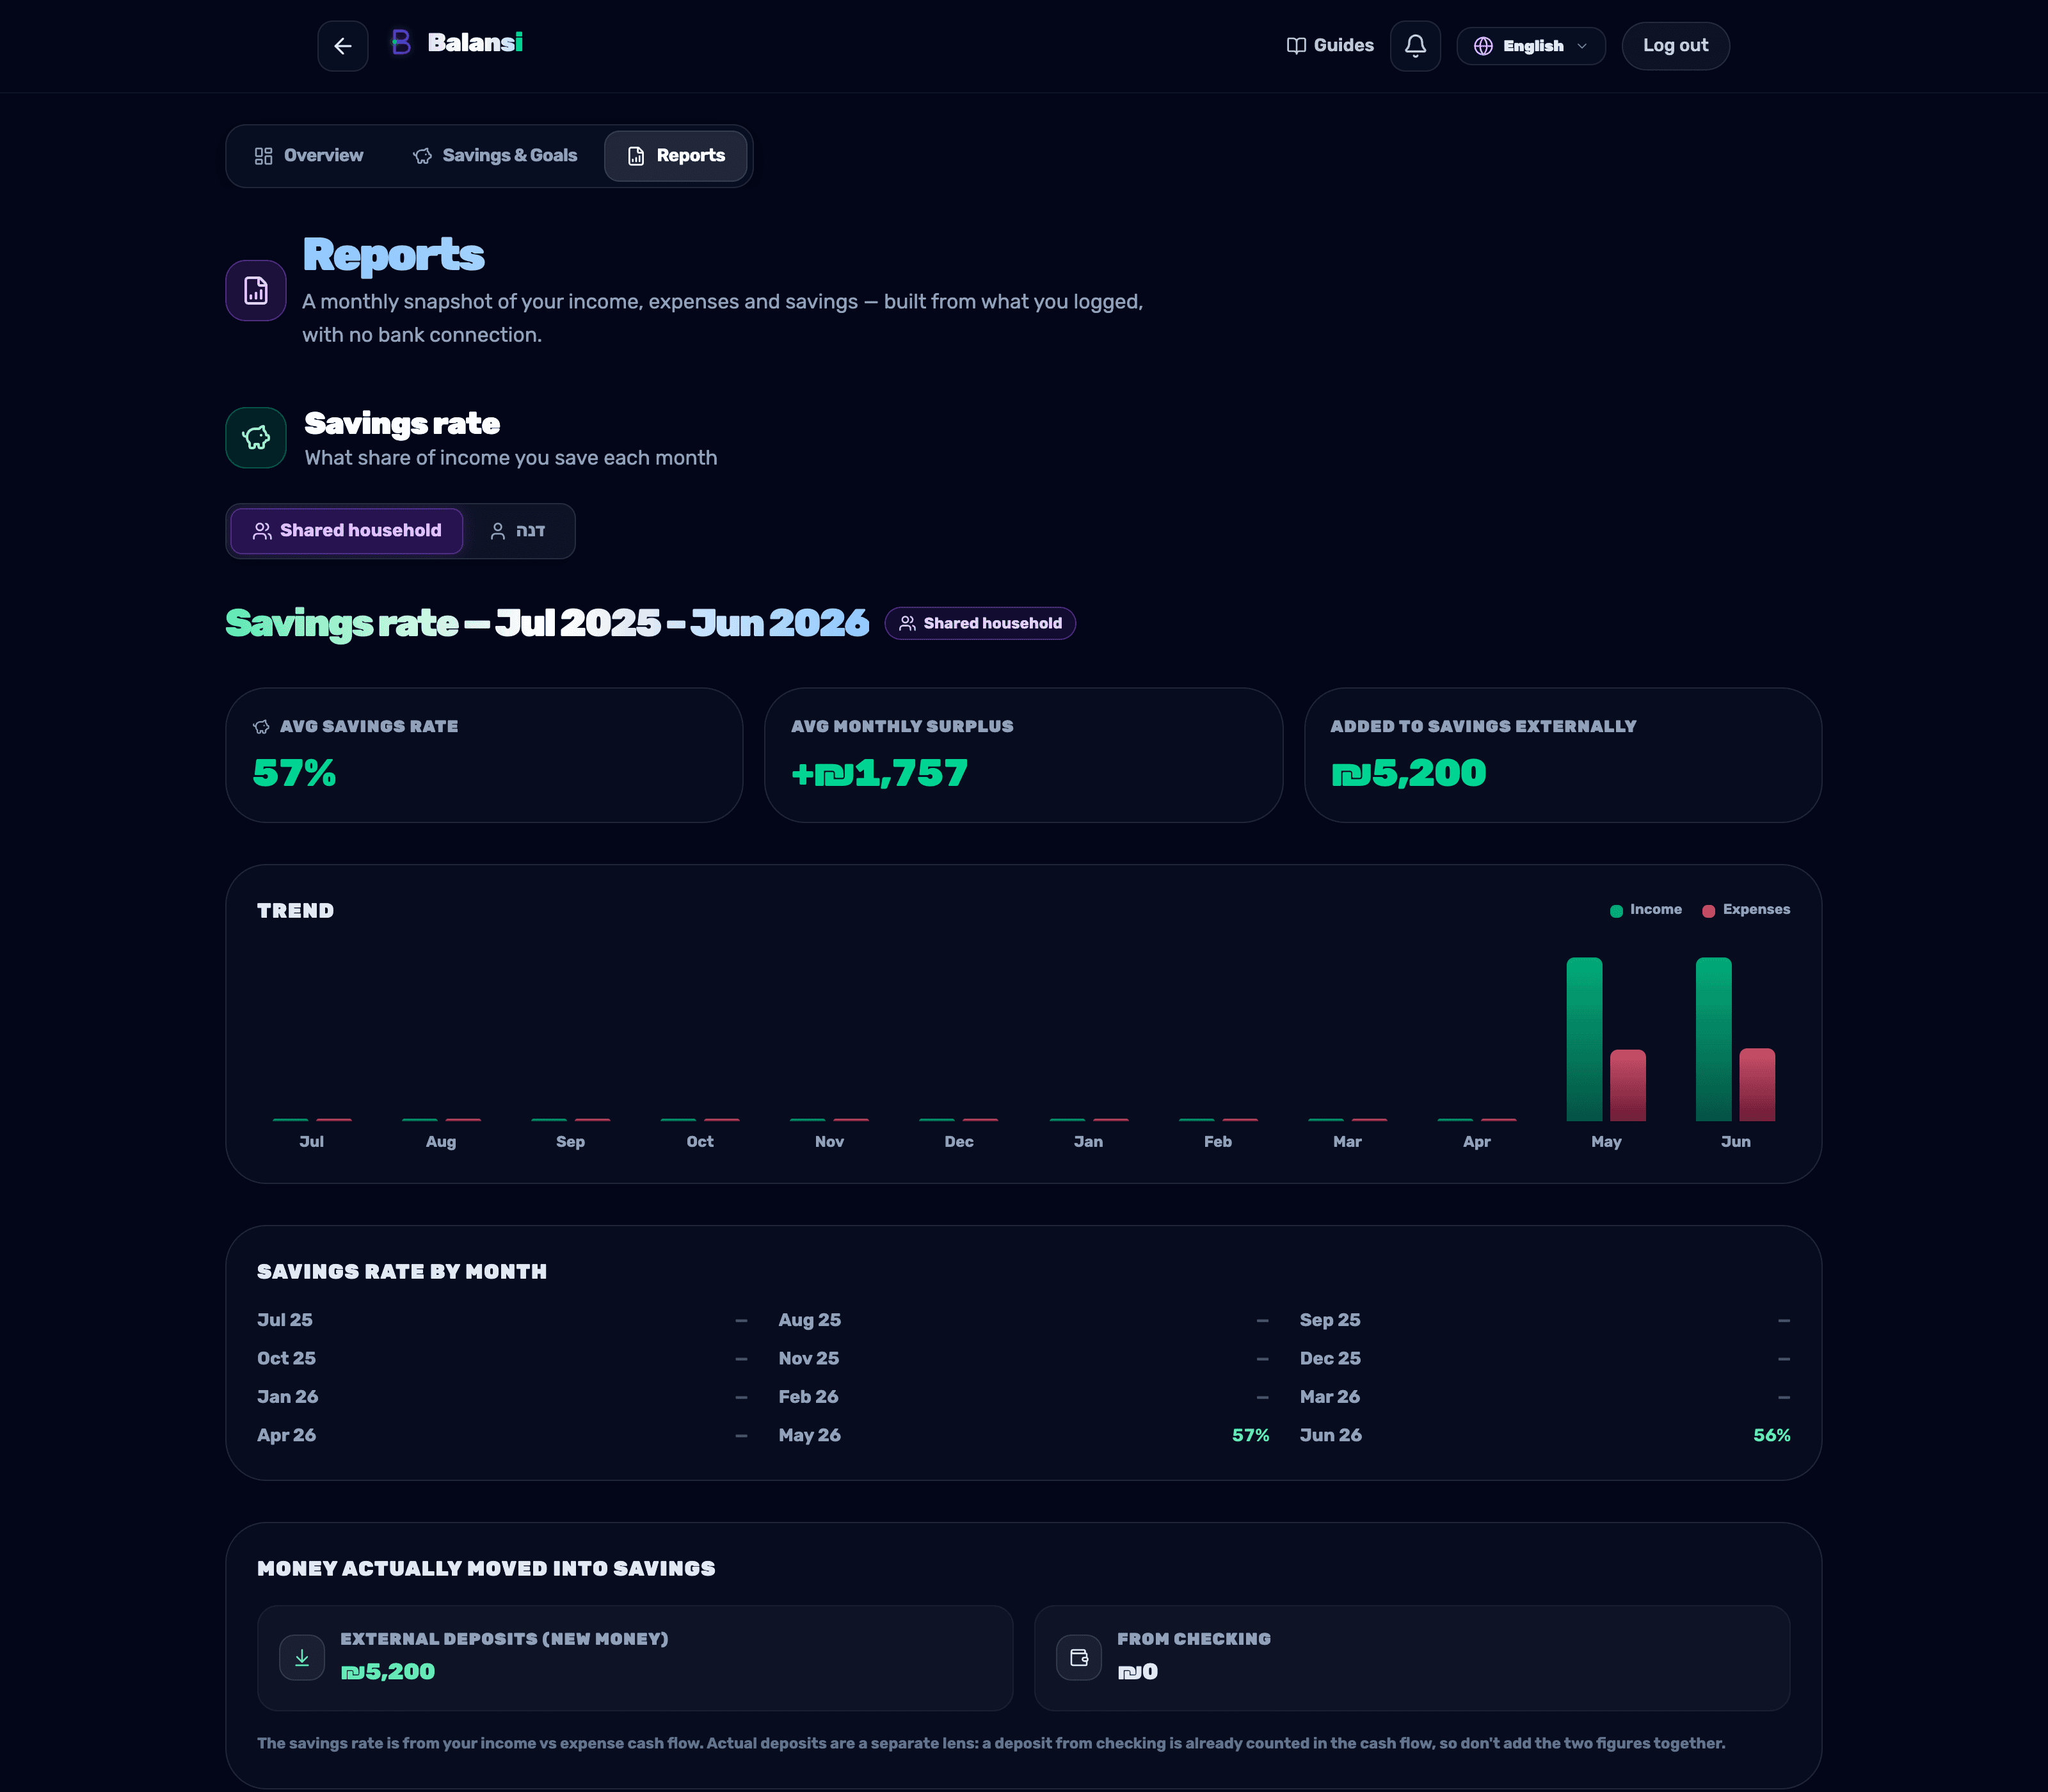
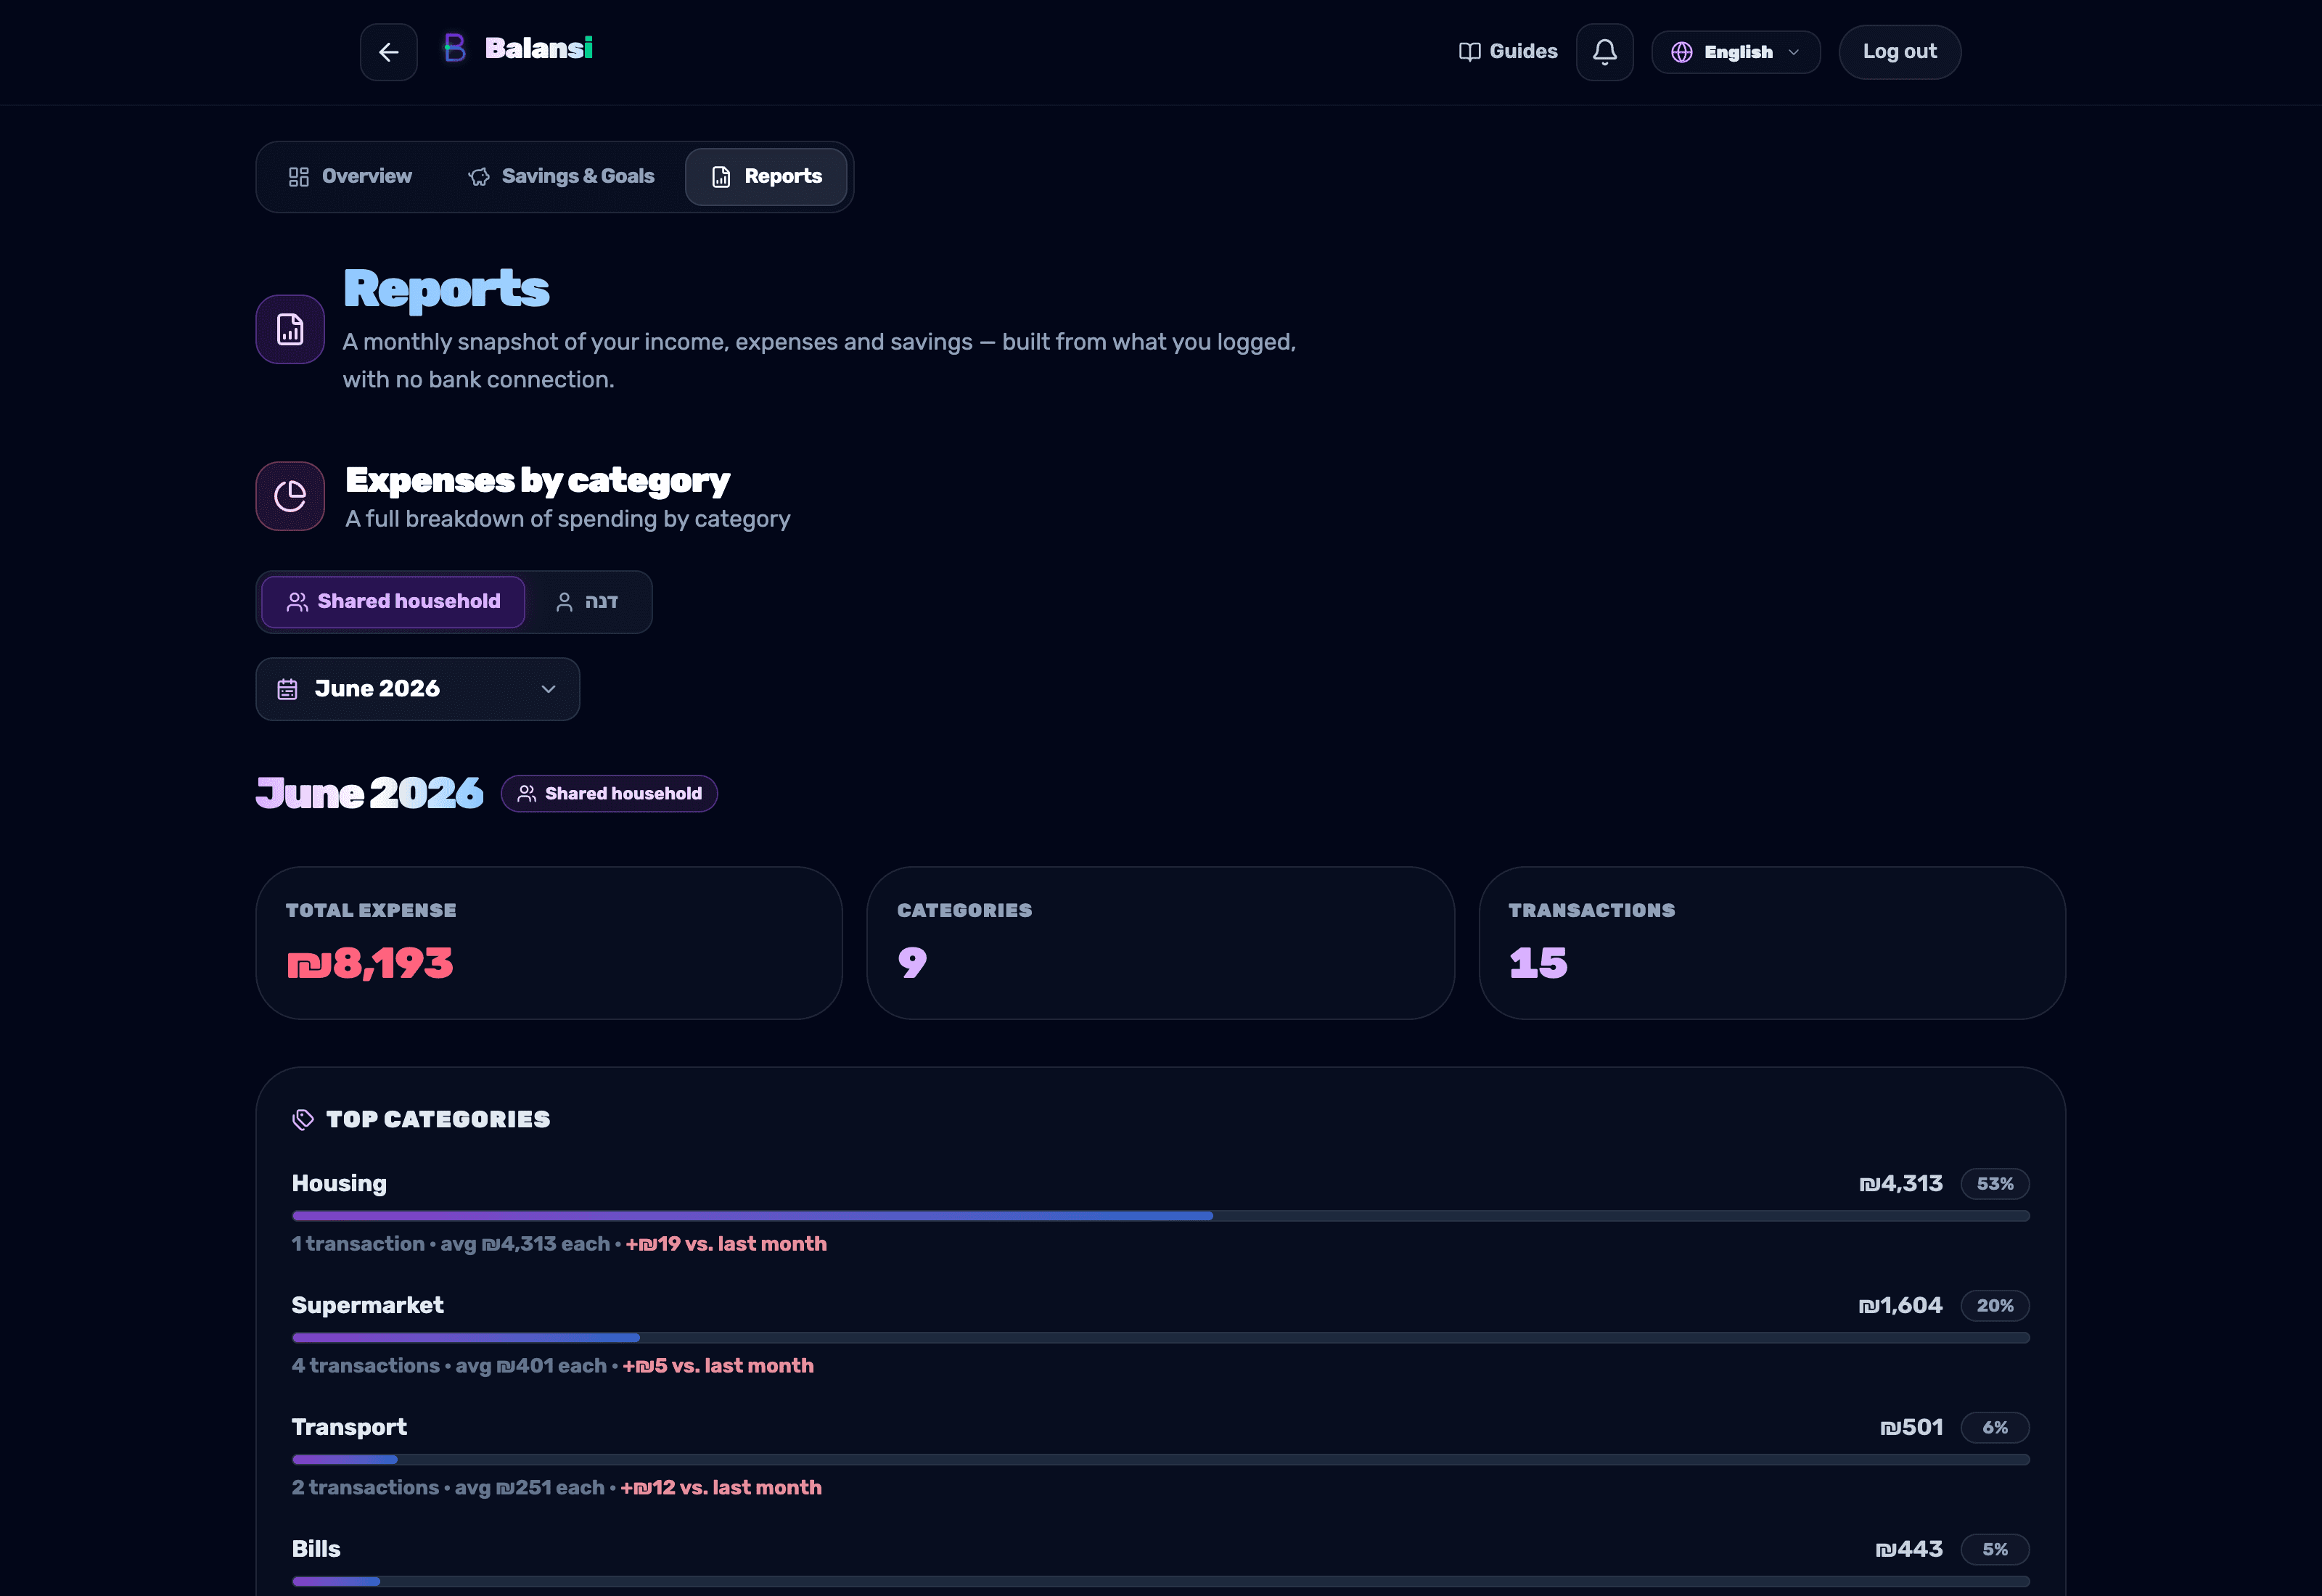
In the "More reports" row, tap a card to make it the active report: "Expenses by category," "Budget adherence," "Income and expense trend," "Annual report," "Subscriptions — annual summary," "Savings rate," "Net worth," and "Pension." A report that isn't built yet is marked "Coming soon."
- 5
Track trends over time
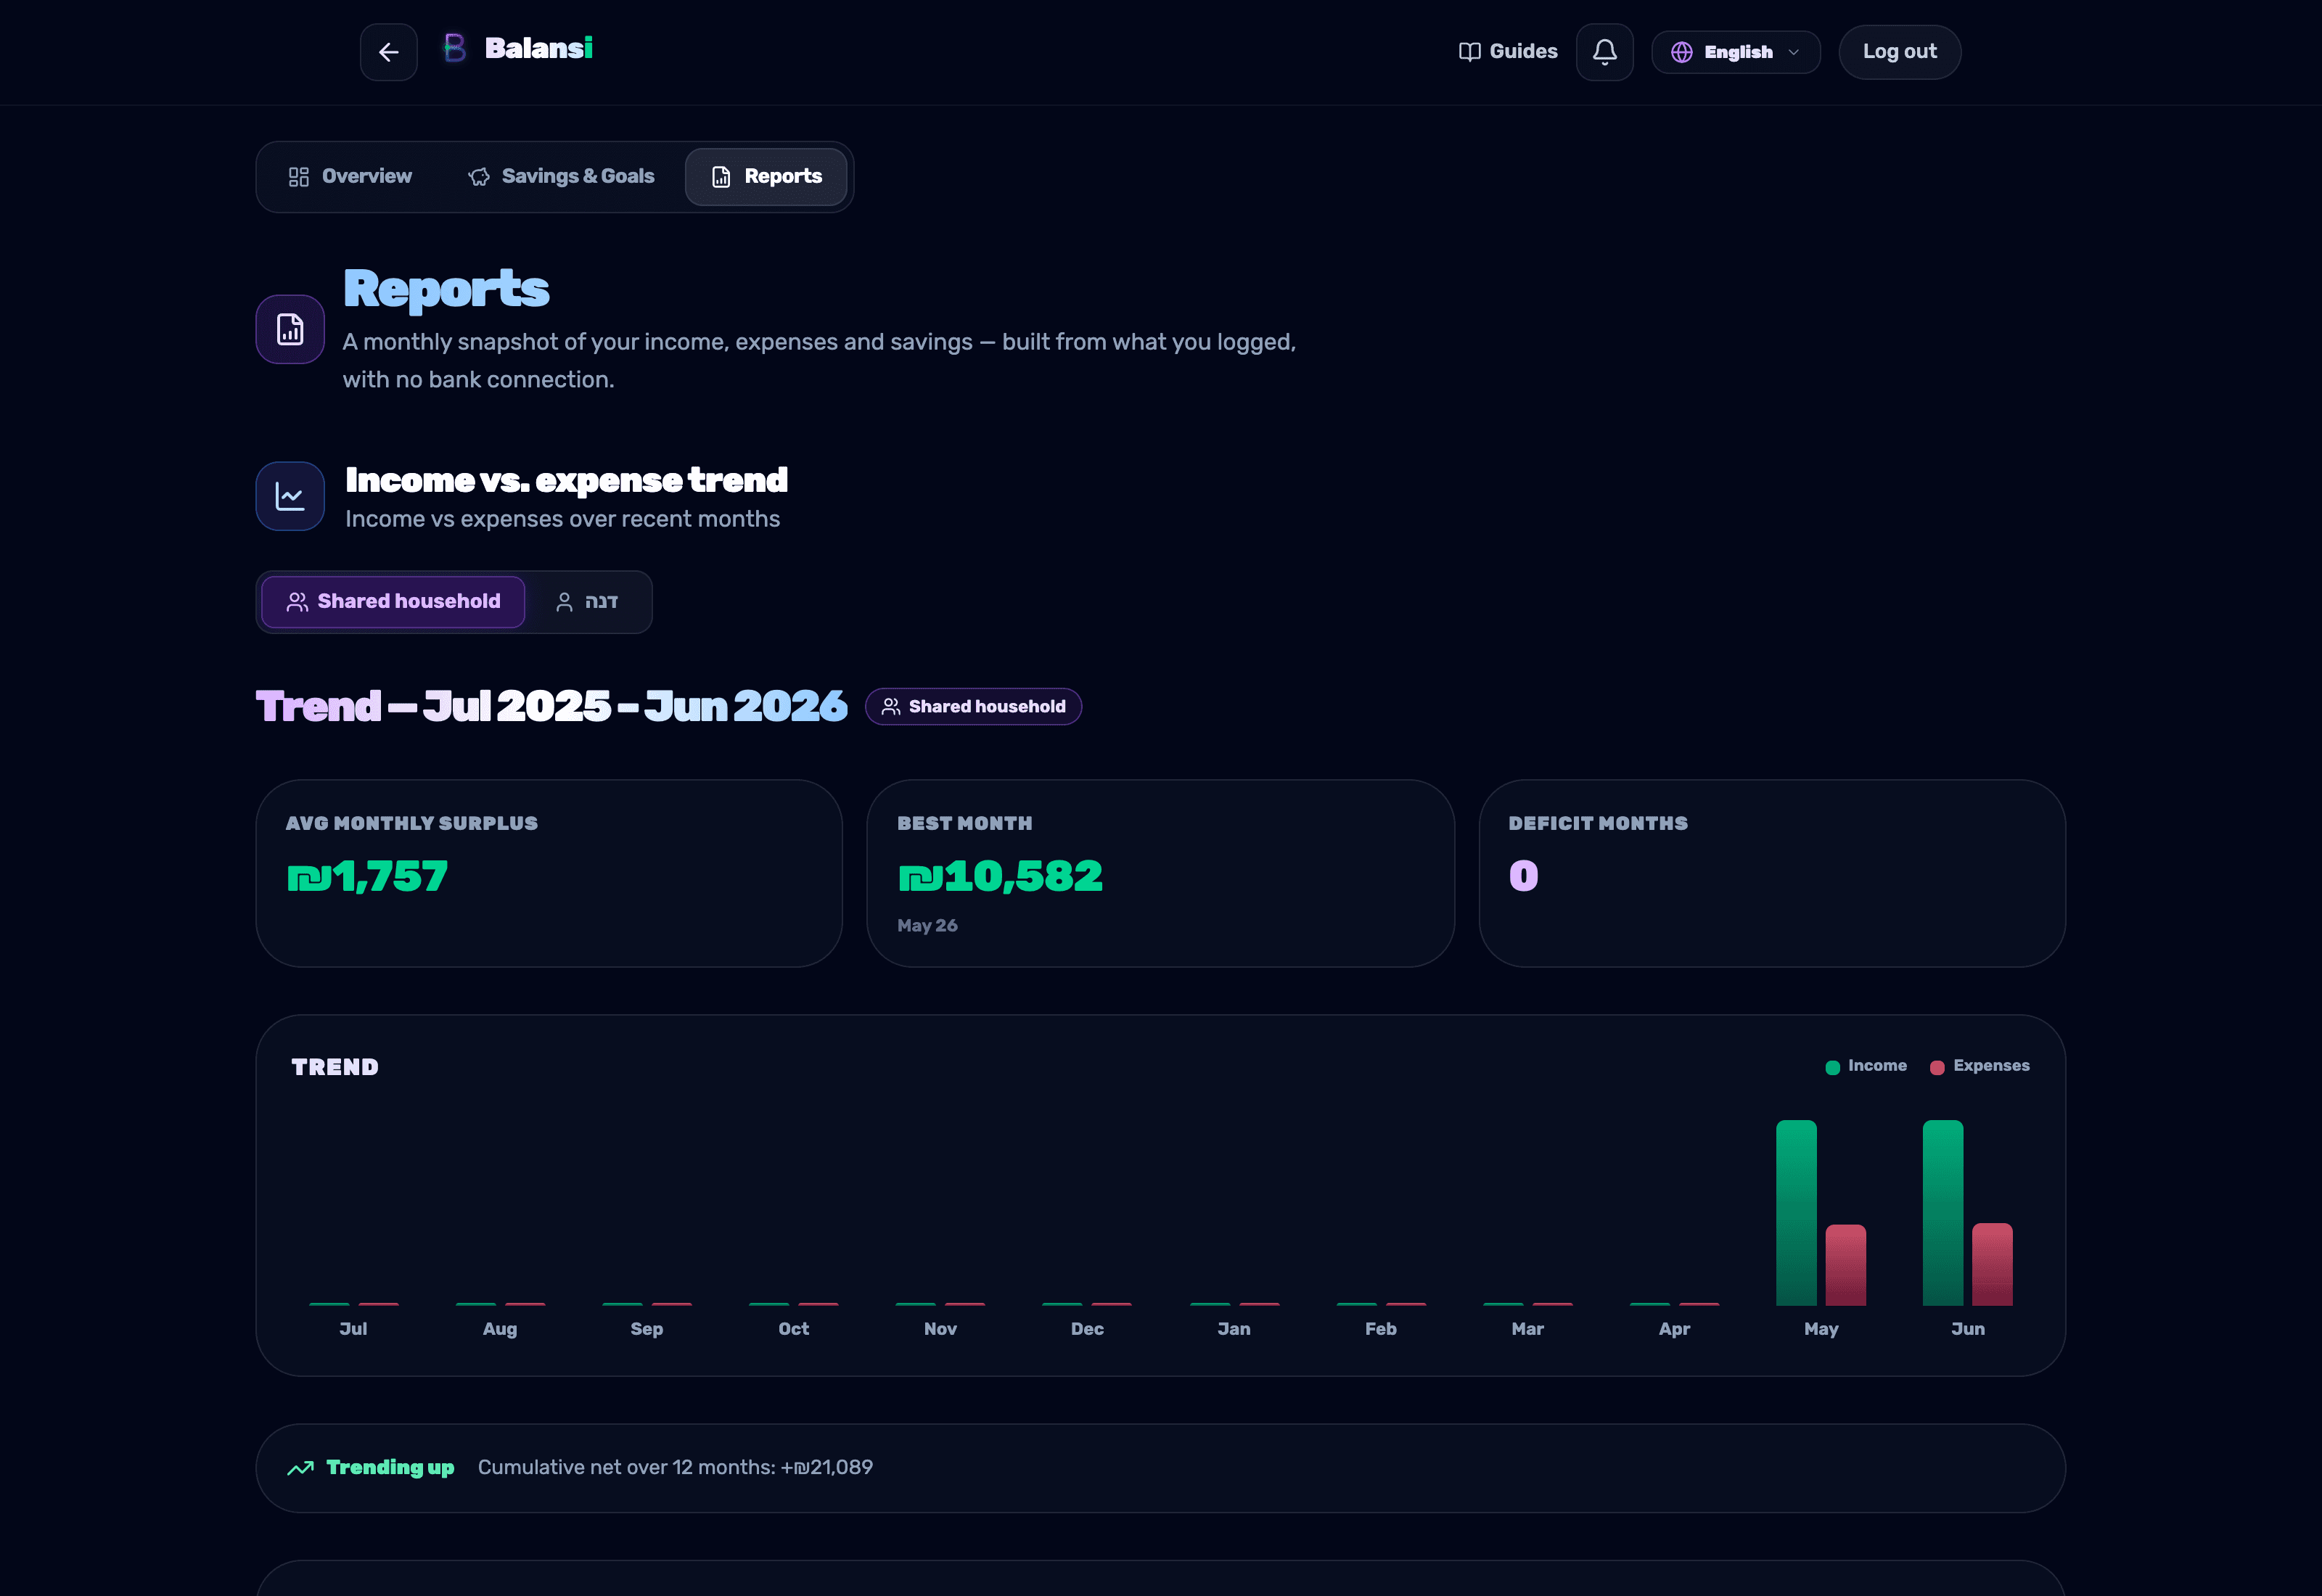
The "Income and expense trend" report shows month-by-month movement, including "Average monthly surplus," "Best month," deficit months, and a trend direction ("Trend is improving" / "weakening" / "flat"). The "Savings rate" report uses the same logic to show how much of your income you saved each month.
- 6
Request AI insights on a report
Reports that support it have a "Generate AI insights" button (or "Refresh insights" after the first run) that produces a "Summary" and "Savings tips" based on your data. At least 15 transactions in the month or year are needed for insights to be generated.